Finding Austin neighborhoods where homeowners actually move
I built a pipeline to rank every Austin-metro subdivision by how often its residents actually sell and leave. Not builders flipping new product, but real homeowner churn. 6,300 subdivisions, two CAD rolls, 33,000 MLS sales, and a Census median age cross-map.
I built this at Rivet Real Estate to answer a simple question: which Austin-metro subdivisions have the highest rate of homeowners actually selling and moving on? Not builders moving new inventory, not absorptions. Actual resident turnover. The kind that signals motivated sellers, lifestyle transitions, estate activity, relocation churn.
Turns out answering that question cleanly required fixing a measurement problem most off-the-shelf tools don’t bother with.
The measurement problem
The naive version of turnover is homes sold in the last six months divided by total homes in the subdivision. That number gets wrecked by new construction.
Take a subdivision with 100 existing homes and 50 new ones a builder just finished. If 15 of those new homes sold in the last six months (new construction moves fast), raw turnover reads 15/150 = 10%. Looks like a hot market. But the original 100 homeowners may have sold nothing. That 10% is entirely builder absorption, not resident churn.
The fix is to filter both sides of the fraction. Count only homes built before 2025 in the denominator. Count only sales of homes built before 2025 in the numerator. Now you’re measuring how fast the pre-existing neighborhood is cycling, not what a builder is doing down the street.
That required pulling year-built data out of both county appraisal rolls. Travis CAD’s IMP_DET.TXT is a 1.9 GB fixed-width file with year-built at byte positions 85 through 89. Williamson CAD has a segment export. Both got parsed, joined to the inventory denominator and the sales numerator, before any rates got computed.
After that filter, 635 subdivisions that looked high-turnover on raw data dropped off the list. New-build absorption had been doing almost all the work.
The pipeline
The data comes from three places.
Travis and Williamson CAD appraisal rolls are the denominator. Both counties publish annual property data exports. I parsed these down to single-family residential, deduped by parcel ID, normalized subdivision names, and pulled year-built per parcel.
Rentcast MLS API is the numerator. Sold listings pulled by ZIP code for Travis and Williamson county ZIPs. Each listing gets matched back to a CAD subdivision by address, then by fuzzy subdivision name, then flagged unmatched if nothing sticks. 62% of 33,000 listings matched cleanly. The other 38% are mostly condos, townhomes, rural parcels without a subdivision, and a long tail of addresses the CAD rolls don’t know about.
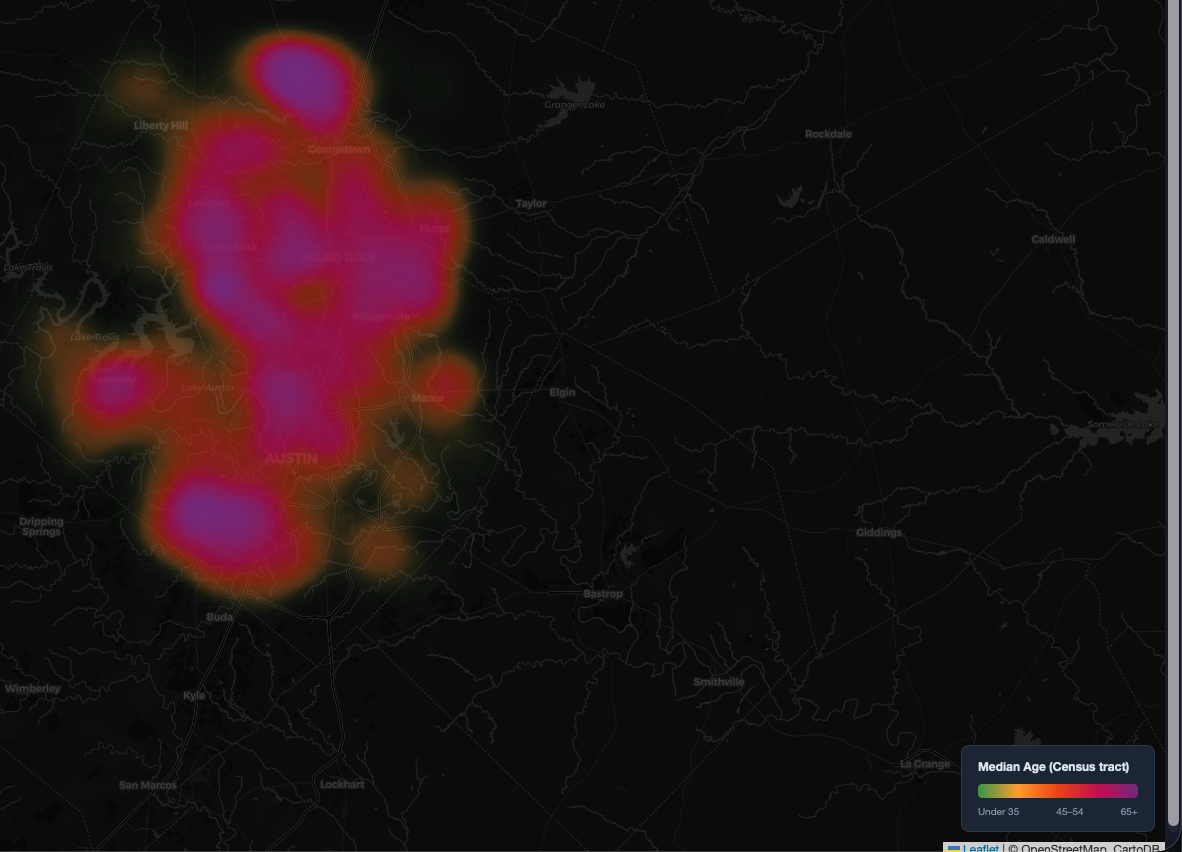
Census geocoder + ACS 2023 5-year is the age cross-map. Every subdivision gets a centroid from the mean lat/lng of its matched listings. That centroid goes through the Census geocoder to get a tract GEOID, and the tract’s median age comes from ACS variable B01002_001E. No API key needed for the geocoder. The ACS fetch uses a free Census key and one HTTP call per county.
Matching 6,300 subdivision centroids to Census tracts took about four minutes in parallel with 15 threads. The tract-level median age is an approximation since a large tract can contain multiple demographically distinct subdivisions, but it’s the best public-data proxy available at this geography without buying a data license.
What the rankings show
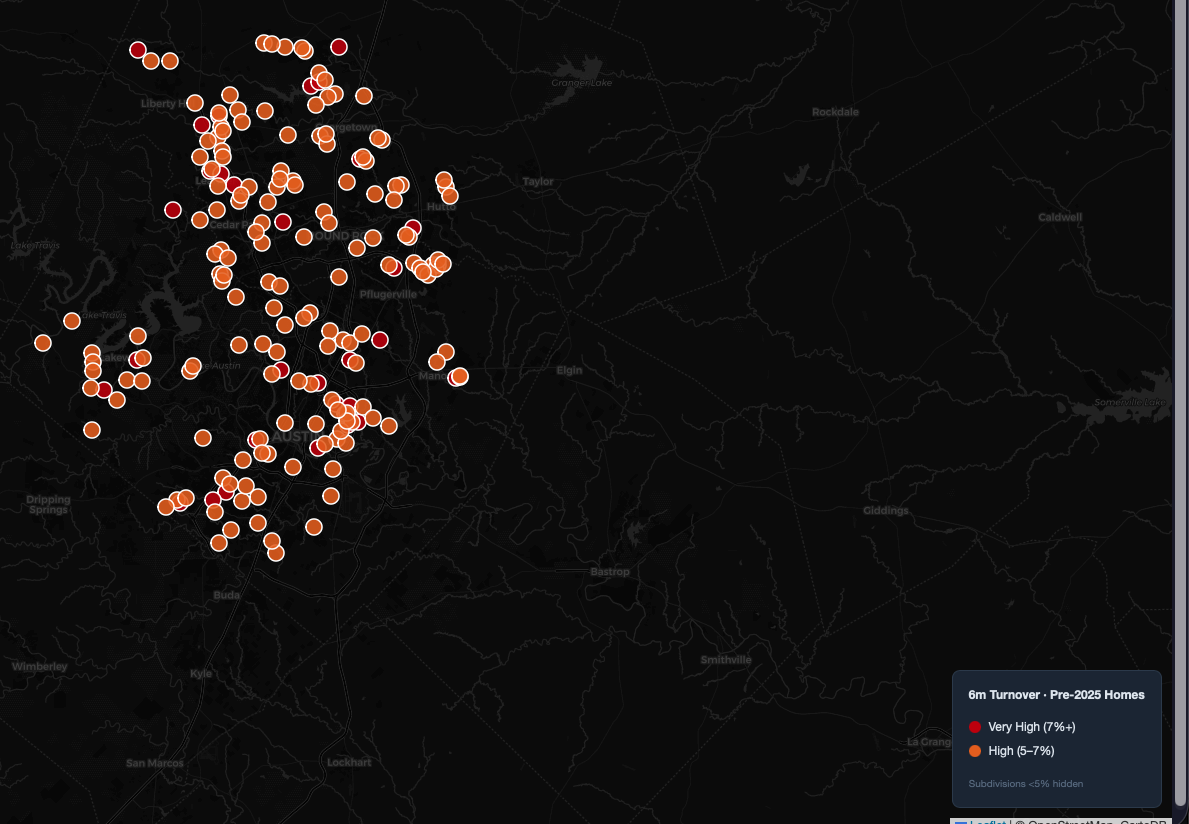
After applying a 50-home minimum on pre-2025 inventory (small denominators make turnover rates unreliable), the top of the ranked list breaks into two groups.
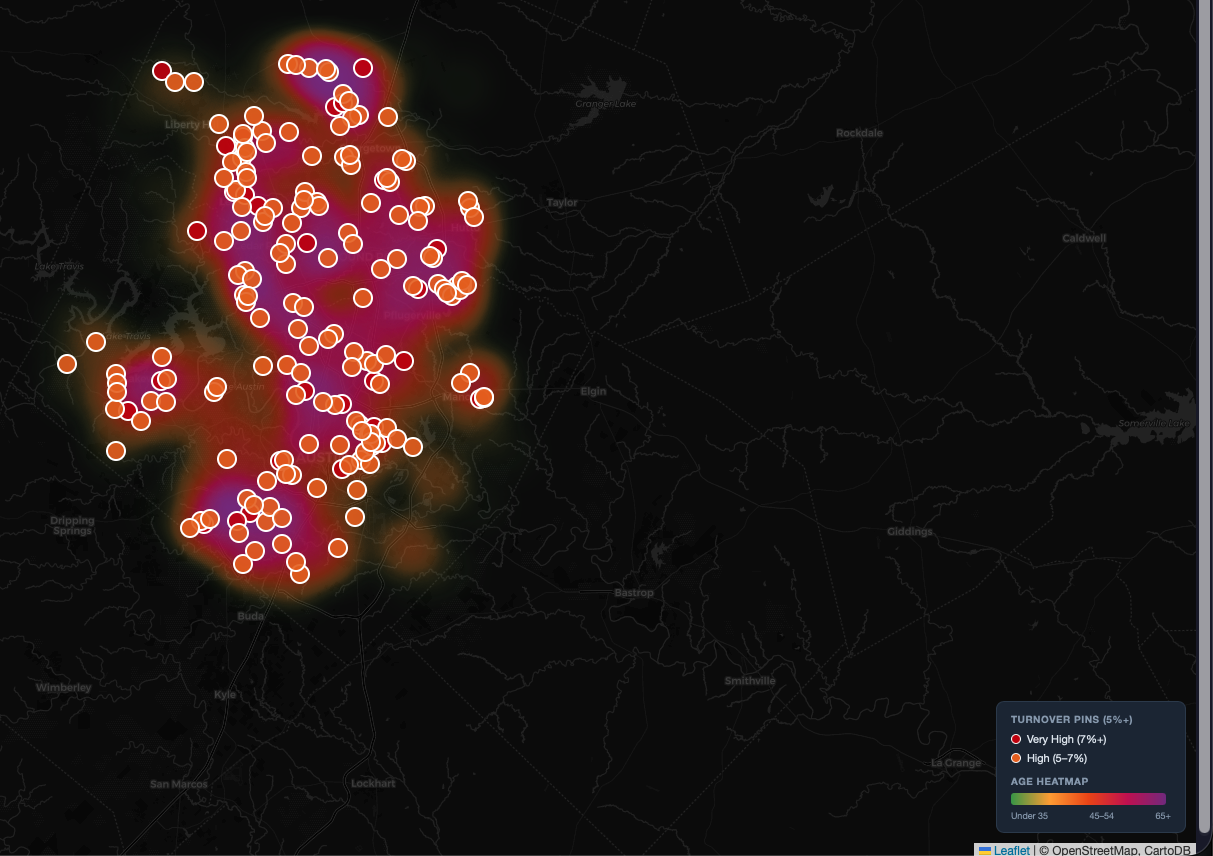
Older established neighborhoods with real churn. Subdivisions built in the 1970s through 1990s where the original homeowners are now in their 60s and 70s. Life transitions drive consistent selling: downsizing, estate sales, retirement moves. Six-month pre-2025 rates in the 7 to 14% range. These are the ones the age cross-map was built to find.
Newer subdivisions with thin pre-2025 denominators. A subdivision built mostly in 2022 and 2023 with 60 pre-2025 homes and 5 sales in six months shows 8.3% turnover, but you’re looking at noise from a small sample. The inflation flag catches the worst of these, but denominator size is the real issue. The right filter is pre-2025 homes at 50 or more, not total homes.
The age cross-map found 8 subdivisions that combine high turnover (5%+ on a 6-month pre-2025 basis) with a Census tract median age of 55 or older and at least 50 pre-2025 homes. Those 8 are the clearest signal in the dataset: neighborhoods where residents are aging, selling at above-average rates, and the denominator is big enough to trust.
The surprise
The inflation flag caught more than I expected. Of the roughly 3,950 subdivisions with 50+ total homes, 635 had new-construction inflation flags. Either a big gap between all-homes and pre-2025 turnover, or fewer than 75% of homes being pre-2025 vintage. That’s about 16% of the analyzed universe where raw turnover would’ve led a target list in the wrong direction.
The geographic pattern was obvious once I saw it. Georgetown, Liberty Hill, Hutto, Kyle, and Buda dominate the flagged list. The fast-growth outer ring. Central and South Austin are almost entirely clean.
What I’d improve
The minimum subdivision size filter should be based on pre-2025 homes, not total homes. Right now a subdivision with 55 total homes (40 pre-2025, 15 new) passes the filter but has a denominator of 40. One sale looks like 2.5% turnover. That’s a one-line fix and it would clean up the top of the rankings.
I’d also add a sold count floor, probably 3 or more sales in the window, because even with a 50-home denominator, 1 or 2 sales is too thin to rank on.
The Census age side has an honest limitation. Tract-level median age is a rough proxy. Block-group estimates would get you tighter geography, but block groups are noisier at the 5-year ACS level because of smaller sample sizes. Tract is the right tradeoff here.
A v2 would pull permit data from Travis and Williamson county permit APIs to get a forward-looking view of where new construction is still absorbing. That way you’re flagging upcoming inflation before it hits the CAD roll, not just current inflation.
If you work in residential acquisitions, wholesaling, or any business where finding motivated sellers before they list matters, the question this pipeline answers is worth the engineering. Contact info on about.